Learning Centre
Add Category Rate Data
The Category Rate data table combines years, wards, classes, categories, and allotments to create the data that is displayed when a website visitor makes their selections in the Property Tax Calculator.
Please make sure that you have completed the property tax field data before starting this process. Category Rate data is added using drop down menus which are populated from the tax field data. You may find your spreadsheet missing options if the field data is incomplete.
Adding the category rate data
Each year, ward, and class requires information for each category and allotment.
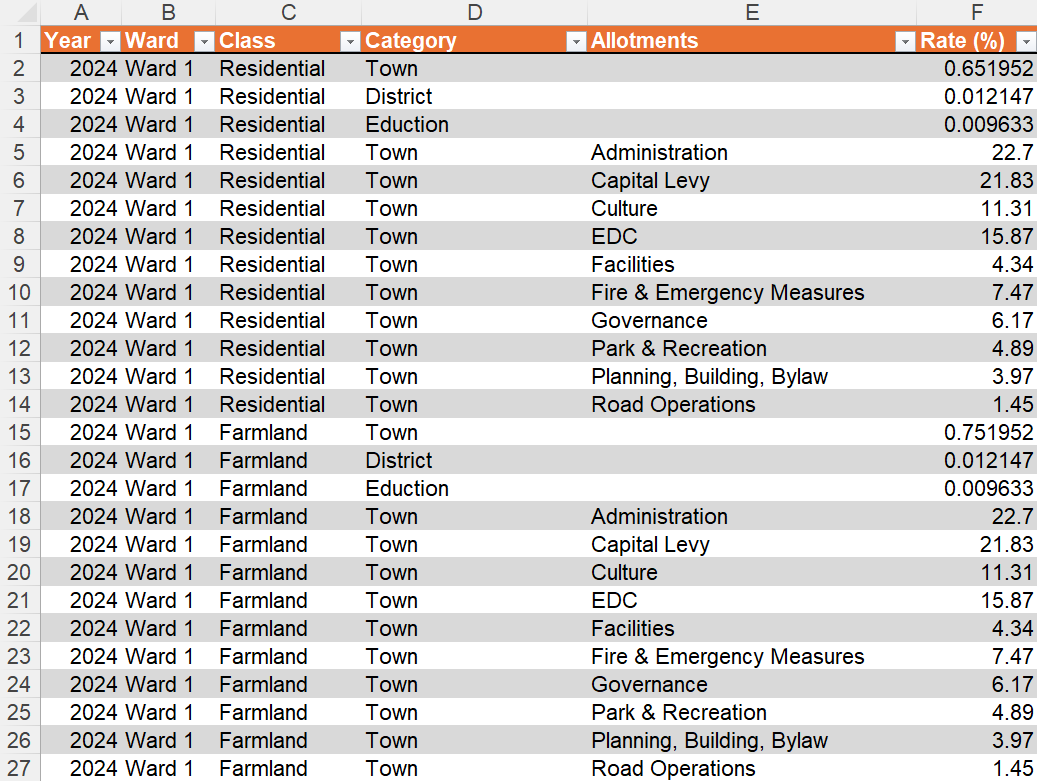
In this example we can see the data for the year 2024, ward 1, and the residential class. We also see the details for the allotments in the town category. Complete data would also include allotments for the district and education category, but these are not shown.
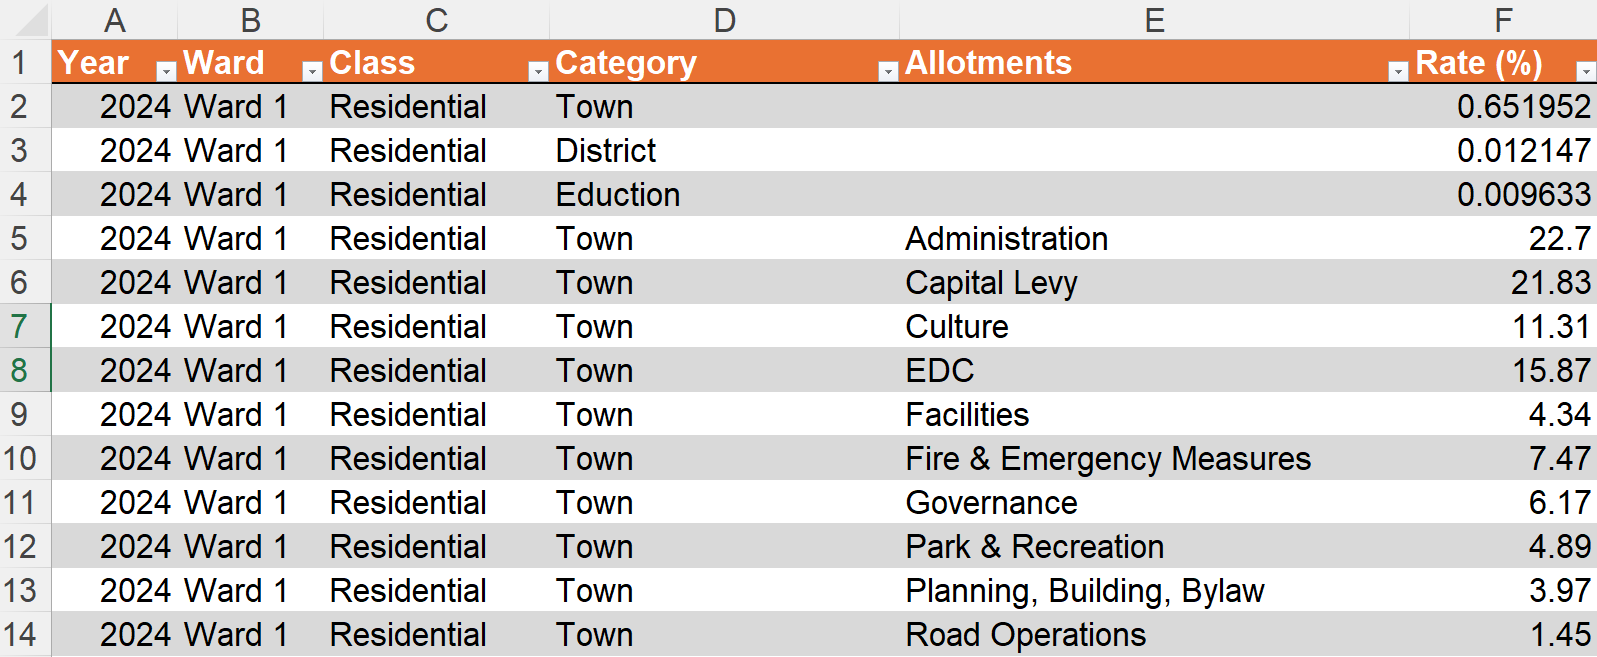
Setting the category tax rates
The first thing to do for each set of year, ward, and class is to set the tax rates for each category. This is the percentage of property tax that is allotted to each of these categories. In our example this section of the spread sheet looks like this:
To add the category rate data for categories follow these steps:
- Open the property tax calculator excel spread sheet
- Select the 'Category Rates' worksheet
- In the 'Year' column use the dropdown to select the desired year
- In the same row select your target 'Ward' and 'Class'. Year, ward, and class should be the same for all the data rows in the set. If year, ward, or class change data entered would apply to a different data set
- Select your target category in the 'Category' column. Note that the order of your categories here is reflected in the public display
- Leave the 'Allotments' column blank. We'll add allotments in the next step
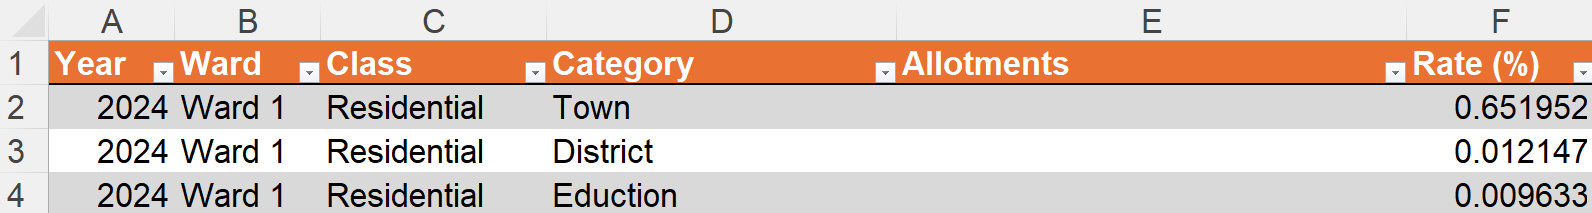
- Enter the percentage of property tax allocated to your selected category in the 'Rate (%)' column. This represents the percentage of the total assessment allocated to that category. In our example 0.651952% of the total assessment has been allocated for town expenditures
- Repeat steps 3 to 7 for each category that applies to this set of year, ward, and class. It is possible that not all categories are required for each set. Don't forget to save your spreadsheet.
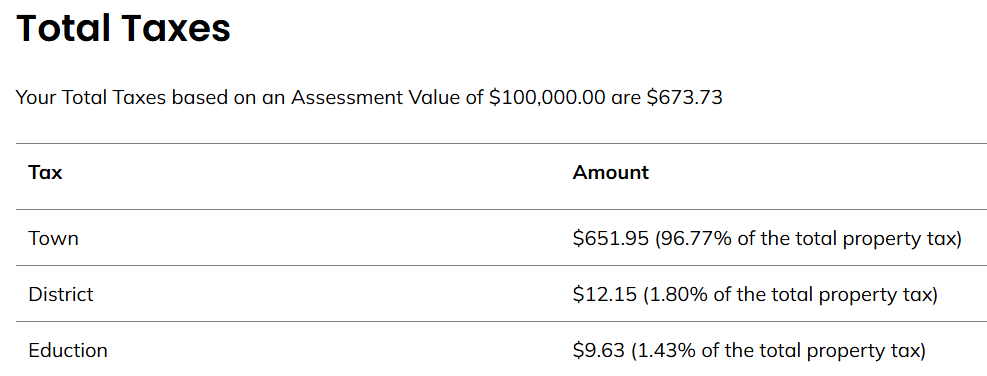
This information populates the 'Total Taxes' area of the Property Tax Calculator. Our example data would output these values for a $100,000 assessment.
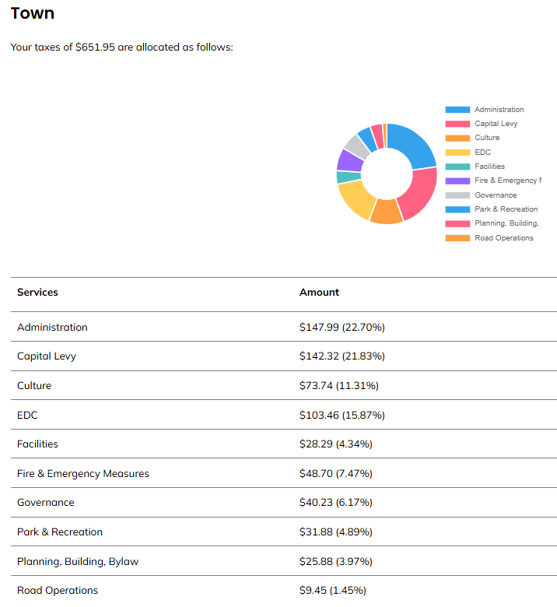
Setting category allotments
Each set of year, ward, class, and category has their own allotments. These are percentages that detail how the property tax for each category is divided.
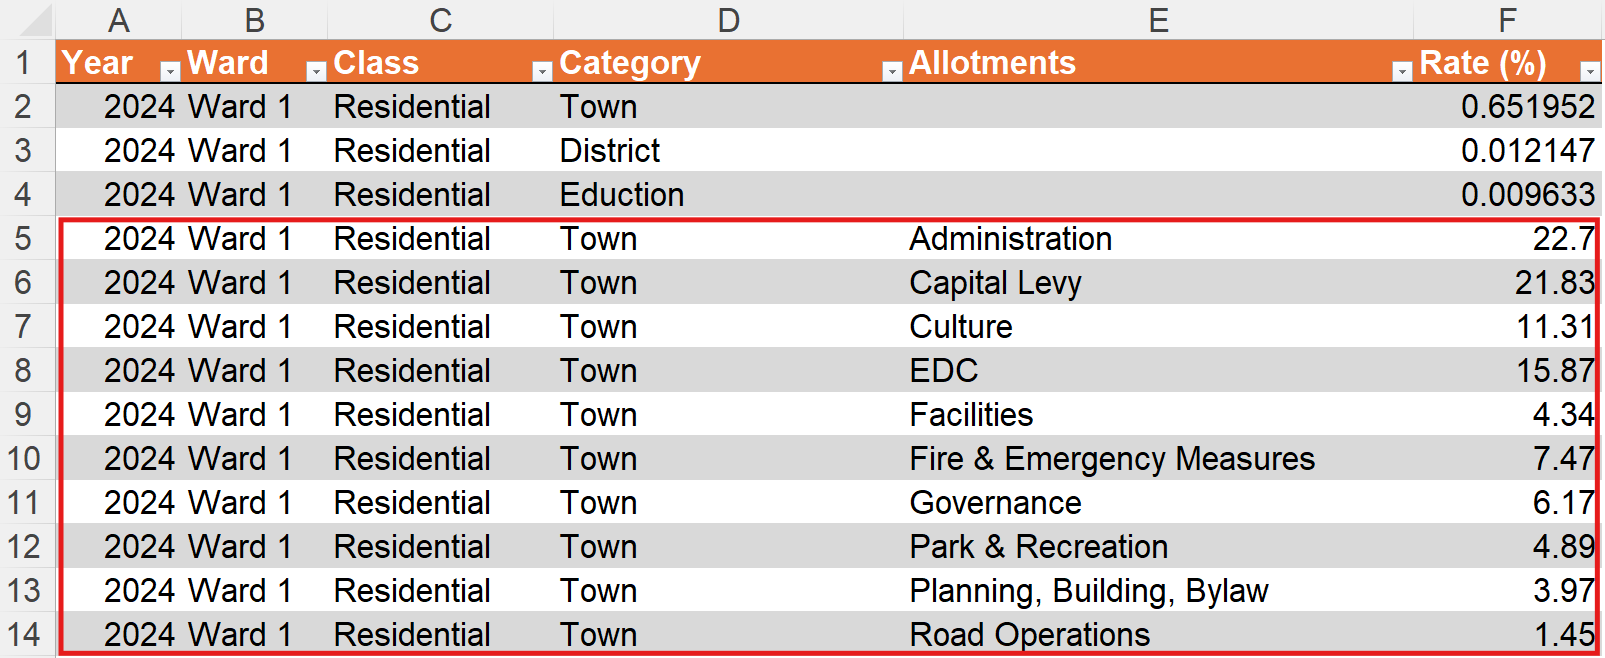
In this example you can see the allotments for 2024, ward 1, in the residential class, and town category.
To add the category rate data for allotments follow these steps:
- Open the property tax calculator excel spread sheet
- Select the 'Category Rates' worksheet
- In the 'Year' column use the dropdown to select the desired year. This should match the year of the target category
- In the same row select your target 'Ward' and 'Class'. Year, ward, and class should be the same for all the allotments in the set and should also match the target category
- Select your target category in the 'Category' column. The category must match the entry the allotments fall under. In our example data all allotments for the 'Town' category also have the 'Town' category
- In the 'Allotments' column enter your allotment name. The order of the allotments here will match the order they appear in on the public display. We recommend adding them alphabetically
- Enter the percentage of property tax allocated to your allotment in the 'Rate (%)' column. This represents the percentage of the category value assigned to that allotment. In our example 22.7% of town revenue has be allocated to administration
- Repeat steps 3 to 7 for each allotment that applies to this set of year, ward, class, and category. Note that all allotments must total to 100% or the tool may generate errors when used. Don't forget to save your spreadsheet
This information populates the category area of the Property Tax Calculator, in this case 'Town'. Our example data would output these values for a $100,000 assessment.
Next Steps
Repeat the steps above until you have added data for all years, wards, classes, and categories.
Note that you can copy and paste entries in part or in full to speed up the process.
Expanding on our example data here's a spread sheet showing the information for the town category and the residential and farmland class.
Once your spreadsheet is complete please return it to your GHD project representative to have it uploaded to your Property Tax Calculator.
Contact Us
GHD Digital Support
Primary +1-866-691-5528
Secondary +1-519-884-2476
Submit Online
Need Help?

